Pre-Hatch Impact Hours Distribution Analysis

Hello everyone. I got curious and took a look at the json raw voting data on the tokenlog page. Having seen these results it feels that this data can help inform our voting designs and the current discussion about IH distribution.

Please read this link for more information about it:

3 Likes

It has been requested to post the text here, so here it is:

Disclaimer

No system is perfect.

We are at the vanguard of self governance.

We learn with every experiement and continuously improve our system designs.

What this is about

Using the json raw voting data on tokenlong (view stats), I was curious to see how quadratic voting would play out given our specific Voting Power algorithm that accounts for IHT and CSTK tokens.

I am sharing what I found because we are counting on quadratic voting as a type of mitigation against a few whales determining the outcome of a vote. It does not appear that this data backs up that assumption. That is my initial impression. There may be arguments that we want a few whales to be able to do so. That they have earned the right. I may have made a mistake in my calculations. I leave these possibilities open to the community to determime.

I anticipate that there will be people with very strong opinions about this result. And there is a real risk that discussions about this will necessitate extending the target date for the Hatch. Or worse, result in any negative sentiment. We are a kind, compassionate, respectful, introspectful and data-driven community and I hope that is enough to avoid the latter.

Link to the xls

Here is the xls. This file does contain the unique addresses parsed from the json but for the sake of simplicity I have assigned each unique address a simple name: Voter A, B, C, etc.

Others are welcome to use this file for deeper analysis that my cursory one.

Voting Power

To the best of my knowledge, this is how Voting Power has been assigned for our use of Tokenlog. I texted directly with Wesley who was generous with his time and explained it to me patiently. If I have made a mistake in my understanding, I welcome the correcion. My goal is to have a shared understanding so we can improve.

Multiplier = the ratio beteen the two token supplies.

Simply put: The % held of the IHT supply is multiplied by the multiplier and then the CSTK score is added that figure.

The examples below show an approximate amount of IHT and CSTK suppy. They are not exact but not far off. The examples were chosen to showcase two opposite-ended cases:

  • High IHT, low CSTK score
  • Low IHT, high CSTK score

Examples:

500 IHT (5% of 10,000 supply)
600 CSTK (0.06% of 1,000,000 supply)
Multiplier, the ratio between the two supplies, is x100.
(500x100) + 600 = 50,600 VP

100 IHT (5% of 10,000 supply)
20,000 CSTK (2% of 1,000,000 supply)
Multiplier is still x 100
(100x100) + 20,000 = 30,000 VP

I wanted to share a discussion we’re having on Discord to make it more visible.

My understanding of Quadratic Voting is that the “amount” of votes should be the square root of the “cost” of voting power utilized. In the raw JSON data, this is mostly true, but not uniformly. There are places where the amount is not equal to the square root of cost, sometimes significantly so. This is not a simple rounding issue.

Does anyone have insight into why that might be?

1 Like

Great analysis @Tamara, it is important to understand the underlying dynamics of the signaling tools we use for decision making, and their implications on the output. Thanks for pulling this together! An important step in our collective learning process.

Good catch @octopus - not sure why this might be, but I did notice something funny in the voting process that could be a possible culprit. Since I didn’t want to vote all in one block, but rather spread votes across multiple proposals, I submitted several subsequent votes for the same proposal, and noticed some funny math when adding tokens later (e.g. 1 of my votes cost 257 tokens, which seemed strange to me.) Perhaps there are some edge cases in the quadratic calculation when casting subsequent votes?

I was mistaken previously; when cost ≠ (amount)^2, it is always the case that cost > (amount)^2.

It does seem that this happens when the same tokenAdress votes more than once for the same number. I can’t figure out any more than that at the moment.

Thanks very much Tamara for posting the data break-down. It gives a fast and accurate idea of what the community wants. Sometimes the emotions can run hot but TEC seems to be doing a professional and considerate examination. Thank you for the time and effort everyone is putting in. This is mostly beyond me as a new small fishy but it matters still. I was really affected by the idea that ‘no system is beyond questioning.’ It is some sort of powerful reminder. A reminder to keep growing and keep evolving. And thanks Jeff for writing the radical piece about re-thinking the praise system. Thanks everyone for doing the hard work. Sending supportive vibrations your way TEC.

1 Like

Thank you for this information. It helped me figure out the issue: when a Token Address votes for the same Proposal more than once, the subsequent contributions are sometimes playing catch-up.

For instance, in the spreadsheet, look at rows 1 and 3, where address 0xaa78…98737 is voting for Proposal 1 in two separate transactions. The first transaction has a perfect square root: 22^2 = 484. The next time this address votes for Proposal 1, the cost is 99732 and the amount is 294, which looks like an undercount. However, sqrt(99732 + 484) = 22 + 294, i.e. this new amount is what is needed to make the total cumulative amount for this address to be equal to the square root of the total cost.

3 Likes

This. :slight_smile:

2 Likes

(from the same link as before HackMD - Collaborative Markdown Knowledge Base but to make it easier to read on the forum, pasted below!)

The end of the first round of voting

Updated the xls with the final results of the first round of votes. The runoff votes are now happening, go here and vote! The vote ends Tuesday, July 6, at 8pm CET.

Of interest to me here is that:

  • If not for the 24 hour extension of the vote (noted by the black line between voter DD and EE), the decision would have been made by, essentially, 4 of the 30 voters.
  • The additional 7 voters in that 24 hour period applied 71% of their quadratic votes (723 of 1023) to proposal 2, which swung the vote in that direction.
  • What lessons are there to be learned here for the upcoming runoff vote and for voting process design in general?

Griff added a tab to do show a recombintion of percentage of voting power applied.

So if:

  • Voter B applied 60% of her voting power to proposal 3 and
  • Voter H applied 40% of her voting power to proposal 3

Then:

  • Proposal 3 would have a combined 100% of a voter-unit.

This is super interesting! It’s not exactly 1-person, 1-vote but it does ingeniously try to simulate that idea. Maybe it’s more like 1-recombined-person, 1-vote .

This is what those results look like:

2 Likes

:zap: :fire:The Runoff is live!! Tokenlog · Token-weighted backlogs :fire: :zap:

Yesterday Jeff, Griff, Tamara, Jess, Juanka, Zeptimus and myself had a session to prepare the runoff proposals and its details. The top 4 went live and considering the community feedback, we decided to extend the closing of the votes to Thursday, July 8th

No more proposals will be submitted in this round and we’ll be hosting debates this week to discuss them. Feel free to host a debate as well by adding it to the TE calendar!

Thanks to everyone who has been involved in this conversation. Please help us promote this voting round!

1 Like

Thanks for your continued analysis @Tamara! I think this is a fantastic learning experience for the TEC community to get a tangible feel for various kinds of voting: 1P1V, 1T1V, quadratic voting, and how all of these tools give us different signals to interpret outcomes in the context of the defined decision space.

I wanted to point out another vote weighting tool called Democonomy (introduced by the Saga project), in case it might be useful here (or in the future) as well. It dynamically weights decision making between whales and minnows according to the gini coefficient of the ecosystem. They also produced a fantastic infographic that walks you through how this plays out in several scenarios.

The infographic is a great way to discuss and demonstrate these various voting optimization tools as well, perhaps something we can emulate! Learnings on every side. :grinning_face_with_smiling_eyes:

For more information on Democonomy voting: Resolving the Stake-Based vs. Participant-Based Voting Dilemma

2 Likes

Very interesting. I’d love to know how it is working out applied there. This really stands out:
Screen Shot 2021-07-05 at 11.02.22 AM

1 Like

I added some pictures today.

Voting power breakdown

The data we have here is empirical. It accurately shows what actually did happen based on our employment of quadratic voting.

The data shows how many unique addresses participated, how much voting power they used and where they applied that voting power. That’s all.

Here is what stood out about the results to me:

  • Before an emergency 24 hour extension was granted:
    • The top 4 out of 30 voters (13%) accounted for 50% of the entire voting power used.
  • After the 24 hour extension:
    • The top 5 out of 37 voters (14%) accounted for 50% of the entire voting power used.
  • Are these the results we expected?
  • Is this what we want?

Before the 24 hour extension:

After the 24 hour extension:

Choosing the runoff proposals

In the end, the final runoff proposals were determined based on Griff’s calculations of applied voting power. That is the simulation of one-person one-vote in one of the xls tabs.

Using that method there is only one change in rank: Jeff’s praisemageddon comes in second, ahead of Sem’s no-intervention. The rest appear to be ranked the same order as the quadratic voting results.

2 Likes

The Saga project closed it’s doors earlier this year. I will ask them if they have any data on how this voting optimization tool worked for them.

In terms of voting optimizations (quadratic vs 1P1V vs democonomy), I wanted to share some feedback on the IH process so far from @mzargham: the power law distribution of IH is exponential, not polynomial, so maybe you need LOG voting not square root. I wonder if this is an addition to Tokenlog that could prove useful in this and/or future votes with exponential (i.e. highly inequitable) token distributions.

In order to help participants remain neutral in the discussion and realign this debate with Rawl’s Veil of Ignorance, he also recommended a fantastic mechanism to help large holders separate the outcomes of this discussion from its impact on their personal holdings: what if we decided that there was going to be a lottery and everyone was going to have their IH swapped (or averaged) with the person they drew at random? I think this is a fantastic thought experiment that may sway some whales from voting solely for outcomes that preserve their outlandish amounts of IH.

All in all, I think this is a fantastic learning experience for the whole TEC, to have a example data set to run through these various optimization functions and gauge what we feel is fair and accurate, in line with the needs and values of the community. Much better than blindly “trusting the algorithm” that what comes out is truth. Do we want to allow a handful of whales to determine the direction of the TEC, now and moving forward? Making use of a future collective intelligence toolkit demands that we be critical and thorough with our analysis and use of these tools. Thanks again for all your hard work in pulling and analyzing this data @Tamara!

1 Like

Respectfully, I respect clarification on this. Power-law distributions and exponential distributions are completely different things. What aspect of this distribution is leading to the claim of “exponential”?

Power-law distributions have a roughly linear relationship between log(x) vs. log(P(x)), where exponential distributions have roughly linear relationships between log(P(x)). If this were an exponential distribution, we would expect roughly the same % increase along similar scales. Do we see that?

It’s a technical but important question to iron out, since we’ve been working on the assumption of this being a Pareto power law distribution. I’m open to being convinced that this is better fit by an exponential distribution, but it’s a strong claim that needs evidence. It would be unusual to see human work or resources following an exponential distribution, and would indicate that Impact Hour distribution was really abnormal in some interesting way.

4 Likes

Remember, the IH’s only represent 10-25% of the TEC Hatch tokens (most likely around 20%), and the rest of the Hatch Tokens will be held by members of the Trusted Seed that send wxDai into the Hatch. Then both groups will be diluted by the Minting of tokens from the Augmented Bonding Curve.

3 Likes

Is voting power relevant?

Quadratic voting specifically addresses the issues around voting power distribution, only looking at voting power is ignoring the quadratic voting factor and I would argue creates irrelevant statistics.

We count votes, not voting power, so we should look at votes when analyzing the data.

I didn’t make the charts, but i added the vote math to the spread sheet and it took 9 voters before the extension and 10 voters after to have a majority.

    • The top 9 out of 30 voters (30%) accounted for 50% of the entire votes counted.
  • After the 24 hour extension:
    • The top 10 out of 37 voters (27%) accounted for 50% of the entire votes counted.

These are pretty good results, skin in the game should be included in the dynamics. IMO the comparison between voting power and the votes that actually count shows why we chose to use tokenlog and quadratic voting.

3 Likes

Thank you for asking this, @Griff

“Is voting power relevant?” is a good question to challenge our most basic assumptions. My understanding is the correlation with votes-that-can-be-cast makes it relevant in this discussion but agree we should also look at the actual votes cast.

I come to a diff result for the first part (see below) but the same for the second.

I believe the following is a true. Is there a mistake I don’t see? Based on the tokenlog data of the primary voting period:

  • it would require 10 of 37 voters, 27% of voters, alone to determine the winner.
  • If all other 27 voters combined, 73% of voters, voted for a single but different option, they would not have enough votes to pass it.

Before the 24h extension: 8 out of 30 voters (27%) cast 50% of the total votes.
After the 24h extension: 10 out of 37 voters (27%) cast 50% of the total votes.

Screen Shot 2021-07-06 at 11.16.00 PM

And here is what that looks like visually:

1 Like

I have created an intervention proposal that address all of the concerns raised by the community. It can be considered an implementation reference of :fire: PRAISEMAGEDDON :fire:

2 Likes

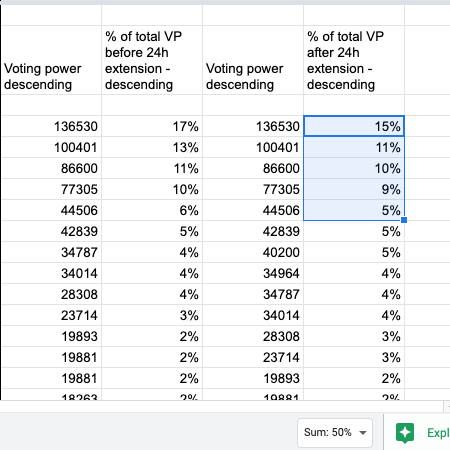
Right now, no proposal has a majority of votes. not even close… The top voted proposal has ~40%, and the results have flipped at some point the Praisemageddon proposal was in the lead in the last few hours, tho the No Aliens proposal has come back and taken a large-ish lead.

This has been a horrible horrible experience for our community. I regret that we even debated this at all. I really do. The repercussions of this debate are going to hurt no matter what the results are.

We have an extremely polarized community right now. This shit is like democrats vs republicans on twitter, it’s gross. :face_vomiting:

That said, we have to accept that we are where we are and think about what is best for the Commons.

The rules set forth for this vote say what we should do in the case of a polarized vote:

From Pre-Hatch Impact Hours Distribution Analysis - #50 by liviade

—Quote—

What if there is a polarized scenario, where 2 different proposals have an evenly split majority of votes in the run-off?

(By evenly split, we consider a difference of less than 10 votes between first and second place.)

In this case, the top 2 authors will be invited to a hack session to merge their proposals together and commit to a collaborative result.

—End Quote—

I think it was a mistake to define this so specifically as 10 votes… and that the spirit of the idea is that we should accept a polarized result (Praise Juanka for the forethought here).

I would like to propose that we follow the spirit of these rules and that Jeff and I hack out a final solution that is a combination of both proposals. We have a lot of different opinions on a lot of things, but above everything else, we love each other and this community and will find a solution that we can be proud of.

What I would propose to start is that ~50% impact hours from :fire: is counted as people’s IH and ~50% impact hours from :no_entry_sign::alien: s counted as people’s IH and the 2 amounts get added together.

The 50% wouldn’t be 50% but would be the % of votes that each proposal got.

This allows everyone to win a little bit, and everyone’s votes to be counted which is just the best that we can do right now. Instead of a clearly defined set of winners and losers, we can have all the voters for these 2 proposals represented in the final outcome.

Honestly, this whole time I have been watching this as a train wreck waiting to happen, i never saw a way to push the car off the track to avoid the destruction ahead…

Amazingly, I think that with a proposal like this we can actually “Split the baby in half” and it will work out. (google that phrase if you don’t know what i’m talking about)

I have had a lot of anxiety about this, and when Livia brainstormed with me and this idea popped out, it was the first time in weeks that I felt hope around this situation. That we could actually have a solution that doesn’t completely just disregard a large swath of our community.

I’m not happy about an intervention at all, I never thought it was a good idea, we should have clearly laid out the rules in advance if we wanted to do that and then stuck with them IMO it’s too late to change the rules and decide to take from some to give to others. But that is not everyone’s opinion and I really love that we have a community of diverse opinions.

Looking forward, COMPROMISE is a value that will hold us together better than accepting the vile, false dichotomies of democrat vs republican, socialist vs libertarian, Good vs bad, right vs wrong.

There is no “good” here, there is no “right” here. There is only best…

Compromise is something I think we as a community can be proud of, and it is at the very least in the spirit of the rules as set forth for this process, if not explicitly defined as the solution for a polarized outcome.

4 Likes