Impact Hour Rate - Deep Dive

Ready to go down this rabbit hole? It’s one of the juiciest pieces of the hatch. How do we accurately and fairly reward all of the hatchers that contribute to the Cultural Build? This component of the hatch is called The Cultural Tribute.

How are contributions measured?
Cultural contributions are measured using a praise system. Hatchers of the trusted seed of the community are enabled the ability to cast praise on any community member that has registered their telegram identity with the praise bot, a community initialization mechanism built into telegram by the commons stack. Read more about Acknowledging & Rewarding Contributions to the TE Commons .

The inital spec in that doc describes the three features of the contribution measurement process, Acknowledgement, Boundary Process, and Single Reward.

Acknowledgement is the ability to track work done. This is achieved with the praise bot which records every instance of praise being cast and saves it into a google sheet. This praise data can then be further processed by community members.

The Boundary Process is the scoring system which determines how many impact hours are granted for for each specific praise instance. Each praise may yield varying amounts of impact hours from, zero impact hours, to low impact hours, to high impact hours. Learn more about the praise quantification proprosal.

Single Reward
Praised work that is directly compensated by funding from Gitcoin grants will yield less impact hours.

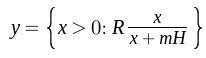
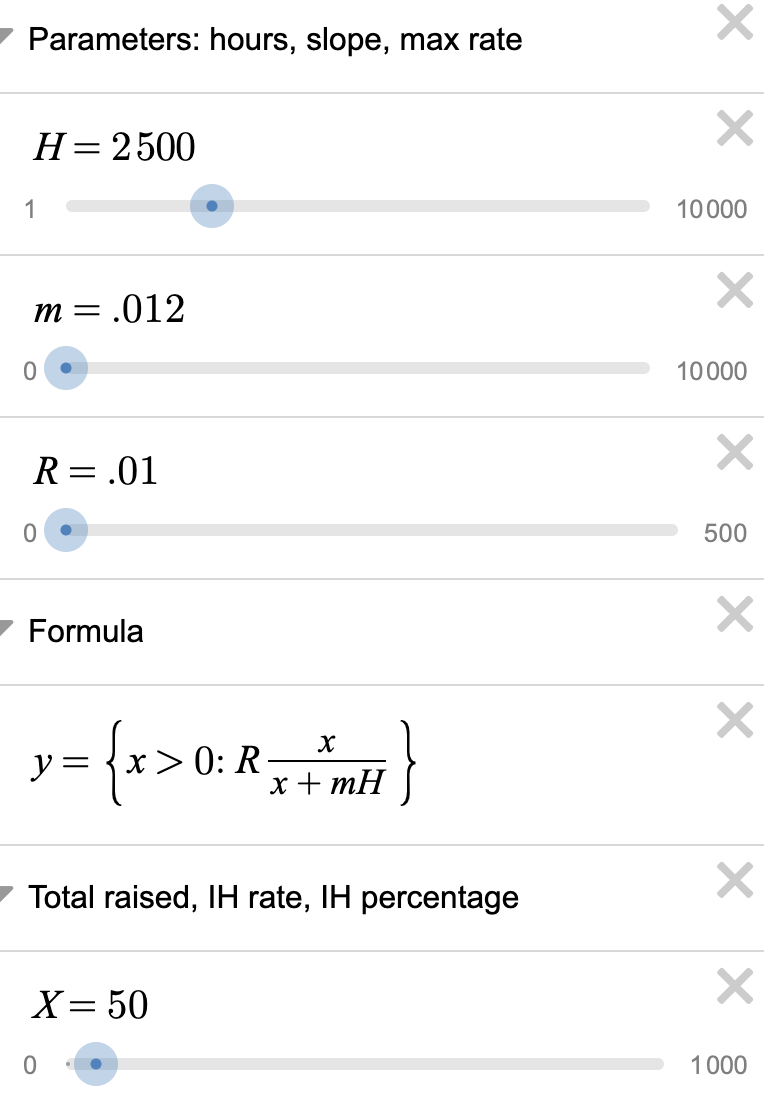
The general idea is that people who contribute to the Cultural Build earn Impact Hours, and that Impact Hours will translate to approximately $20-$200 per hour in Hatch Contributions. 1-10% of the funds donated during the Hatch would create tokens for the people who contributed to the Cultural Build.

Test Hatch #1
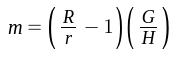
The current TESTTEC system is straight forward. The more funds that are raised, the higher the hourly wage for impact hours becomes. Additionally, the more funds that are raised, the larger the portion of tokens that are paid back to ‘co-vesters’. These two properties mean hatchers are incentivized to raise more funds, and co-vesters are incentivized to invest more funds. A third variable to consider is the total number of impact hours contributed. As the total impact hours goes higher, the hourly DAI payout per hours goes down. These properties can be observed in the example data here, and in the notebook analysis here.

This is clearly a very important and complex aspect of the hatch. There are many facets of this topic that can be touched on, please post any thoughts or additional useful resources in the comments of this thread. If you are wondering where to get started thinking on this topic, I highly recommend starting by reading The Trusted Seed of the Commons Stack. Looking forward to hearing your thoughts!

6 Likes

Last period Impact Hours and Total Impact Hours can be seen in charts through this link

1 Like

I should have linked this (start here): https://medium.com/token-engineering-commons/how-to-earn-tec-tokens-now-an-inside-look-at-impact-hours-7d93043b739d

Let’s hear people’s thoughts on this.

What are you going to spend TEC tokens on?

1 Like

Latest updates as per the last working session. Thank you @Freedumbs00 and team (They wrote this post)!

Please Consider the Following and Post Comments

1 Like

I’ve been translating the IH exploration spreadsheet to a formula where the independent variable (x) is the funds raised, and the dependent variable is the IH rate (y). This is the formula:

Screenshot from 2020-12-14 14-10-05

The formula has three parameters:

  • H : Total number of impact hours.
  • m : Hour slope, or how much funds do we expect to raise per IH. A low number makes a more curved function, whereas a high number flattens the curve.
  • R : Top IH rate limit. It’s an asymptotic limit never reached, no matter how much funds are raised.

Original exploration

We can replicate the original IH exploration with the following parameters:

  • H = 6000 hours
  • m = 1000 DAI/hour
  • R = 210 DAI/hour

You can visualize and play with it in this graph. You can select other parameters, and moving the X slider, you can see IH rate and IH percent based on total raised.

Additional considerations

A high m makes the function practically linear, so I would recommend to set up a lower one of maybe 200 DAI/h. On the other hand we have to be careful on setting up a low m because it also increases the percentage of raised money that goes to cover IH.

Also, in order to have a fair minimum wage, we can play with both R and m having into account a min goal X. So for example with a min goal X of 300k, a R of 80 and an m of 200, we have a IH rate of 16 DAI/h, and this represents the 32% of the raised funds.

3 Likes

This is amazing… so Params we need are:

  • m : Hour slope, or how much funds do we expect to raise per IH. A low number makes a more curved function, whereas a high number flattens the curve.

  • R : Top IH rate limit. It’s an asymptotic limit never reached, no matter how much funds are raised.

Is that right?

2 Likes

Really great work guys, I recommend anyone seeing this to checkout the math widget and play around with it. Notice you can slide x to pick a scenario of raise amount, and then based on the parameters you see r_x and p_x at the bottom as hourly rate and percent of hatch going to cultural build.

My initial comments:

  • I’m not sold on the intuition for m. I can’t quite see how it is ‘expected funds raised per IH’
  • Anyways, if it is ‘expected funds raised per IH’, then notice that the ‘true funds raised per IH’ would be x/h. Plugging that in for m, we get r_x = R/2 which is cool. So if we perfectly guess our raise capabilities then the hourly rate should be 50% of the max.
  • We can put bounds on the parameter space by constraining the results of r_x and p_x. For example r_x >15, 0.01 < p_x < 0.2.

Great initial work, and I’m excited to see this framework evolve.

As far as I can tell, yes, it’s m and R to be decided. Additionally, it looks like we can add constraints to this model such as minimum and max raise, minimum wage, and minimum and max hatch percentages going to the cultural build.

1 Like

That’s right. That’s why I think we can name m as “expected raise per IH”, since it’s the amount IH people get rewarded with R/2. If the raise gets less than m, the reward drops significantly, if the raise gets more than m, the reward increases slowly until it reaches max rate of R.

We can find better names, maybe doing reference to the “half-way”. It’s the raise in which IH receive half of the max rate. What about “half-raise”, or “half-way raise”? I can’t find suitable names, maybe you can continue with the brainstorming.

That being said, it’s important to remark that setting a low m will make it easy to reach a IH ratio greater than R/2, which is what makes the curve. Setting up a high “expected raise”/“half-way raise”, we flatten the curve, making it indistinguishable from a straight line.

Calculator here: https://www.desmos.com/calculator/r8kq0r6e2s

For the test HatchDAO these are the Params I am playing with

m = 30/2500 expected raise/total IH

3 Likes

During user testing we discovered that the Impact Hour Slope concept is too hard for users to grok… and they all wanted to understand it… It became a big blocker for most people trying to propose

So I propose we add a new user facing variable called Curvature

C = R/m

This is used to derive m Impact hour slope… but is… hopefully easier to understand than m, and users can try to forget that there is math and just start playing

updated the calculator: Impact Hours rate

1 Like

Perhaps if you explain what the curve or slope is, and what impact it has on system configurations, that could help people understand what exactly we are trying to configure here?

E.g. “The IH slope denotes the sliding agreement of funds allocation attributed to builders (inputting time) vs backers (inputting funds). At smaller fundraise amounts, builders receive a larger proportion of tokens, while at larger fundraise amounts, builders are better compensated but larger proportions of tokens go to backers. This curve essentially represents a novel form of dynamic ownership allocation between funders and builders.”

1 Like

Impact hour slope is the “expected raise per impact hour” in which builders receive 50% of max impact hour rate (R).

I like @griff’s idea on simplifying it by relating to max rate, but I think it would be more suitable if we use the inverse function of what he is proposing, like this:

C = m/R

This defines C as a factor that multiplies max rate. In order to define a “expected raise per IH” twice as much as “max rate”, we can define C=2. If we want it to be half of max rate, we define C=1/2.

We can define C as a parameter that goes from 0 to 5 (although it could be higher). Here you can find a demonstration here.

I hope you like the idea.

I originally had it inverted like that… since it gives more range at the smaller numbers… but then i had to think of what do we call the variable… and with it inverted, the smaller the number, the more curvature it has.

So if we want to invert it, we shouldnt call it Curvature… cause the smaller the number, the more curvy it is… and this would be non-intuitive…

We could change the name… but honestly, it was harder to find the name than to invert the ratio!

obtuseness
Obtusinity
Linear-ness
Straightyness
inverse curvature
1/curvature

I started from the user experience and worked towards the math.

Curvature is what i think will make sense to the user its like how curvy the IH rate line is, and the Max rate is the asymptote… and then i think its very easy to explain and play with

I understand, it’s a trade-off between user experience and math simplicity.

I still prefer m=C*R because it has more meaning, but in case we go m=R/C I would not add more constants in the formulas. I changed the desmos proposed by griff so it doesn’t multiply R by 500 anymore (it felt arbitrary). I would just make the range of C from 0 to 5, with steps of 0.01. Here is the updated desmos.

Also, there is something that can make things easier. We already consider “target goal” as a parameter. Let’s use it to replace mH in the original formula, because this is exactly what it means. If we reach the “target goal”, impact hour holders will get paid at a rate of “max rate”/2.

The final formula would be f(x) = R * x / (x + Tg). This simplified form is actually used by the smart contract. We would have one parameter less to define for the hatch dao, and overall, less always is better.

Yet another option is defining the curve based on two points, (+∞, maxRate) and (minGoal, minRate).

This gives us two intuitive parameters to define the IH formula, the max rate (nearly impossible to reach), and the min rate, which is the rate that receives each impact hour when the min goal is reached. Target goal could also be used instead of min goal, but min rate felt more useful for modeling.

The formula to get m for the original formula based on min goal G and min rate r is:

Screenshot from 2021-04-28 16-12-32

You can play with the updated desmos here.

THIS IS AMAZING!!!

It is WAY more intuitive to allow the user to choose a point on the line and define the asymptote then they only need one slider to play with to get their slope…

It’s genius!!

I do think the most intuitive point to design around is the Target Goal as opposed to the min goal tho… what do you think, can we play with the equation to make that a thing?

Yes of course, we can use target goal instead of min goal, and add min goal rate as an output to have into consideration. It’s the same formula as above, but G now means “Target Goal” and r is the target goal rate. This is the updated desmos.

What is the Impact Hour Rate at Target Goal (wxDai/IH)?
The Impact Hour Rate at Target Goal (wxDai/IH) parameter determines the amount of wxDai allocated for each Impact Hour earned by the Builders of our community. The source of these funds comes from the amount raised during the Hatch Period and therefore the ratio between wxDai and Impact Hours is dependent upon the amount of funds raised.

Implications & Parameter Options
The Impact Hour Rate at Target Goal parameter is measured in wxDai, and you will have the option to set this parameter anywhere between 0 and ∞ .

This parameter has several implications and determines how much we reward our Community Builders in relation to the amount of Impact Hours they earned. The source of these funds come from the amount of wxDai raised during the Hatch Period, specifically from the unredeemable pool of funds determined by the Hatch% Parameter.

Suggested Range
Depending on your Target Goal, we suggest an Impact Hour Rate of 20-200 wxDai.

Related Parameters to consider when defining the Impact Hour Rate (wxDai/IH) at Target Goal:
Target Goal (wxDai)
Minimum Goal (wxDai)
Maximum Goal (wxDai)
Impact Hour Rate at Infinity (wxDai/IH)

1 Like