When I show people who aren’t familiar with Conviction Voting the Conviction Voting section of the TEC simulator, I have a real hard time explaining what it means. Eventually they nod and say “I get it” but I’m pretty sure they still don’t get it, and they’re just saying that cuz they’re tired of hearing me struggle.
A simple update that I think would make it a lot more intuitive would be to make the x-axis “days until proposal passes” and then instead of selecting a time frame, you select a funding amount and total amount in the common pool. The chart would then look something like this:
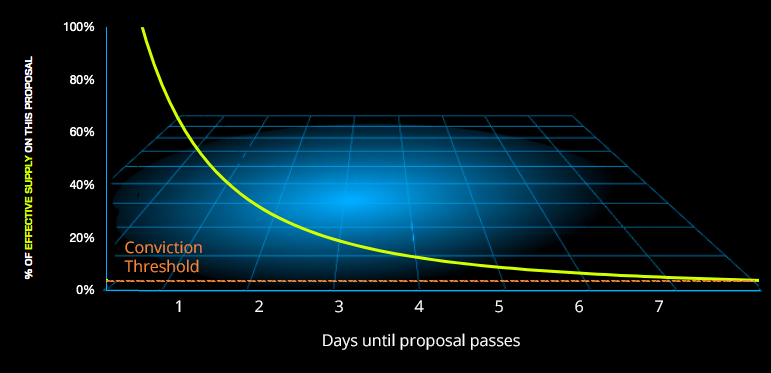
You’d also be able to add a visualization of the conviction threshold for passing in this case too, which is prob the data point people care about most.
Basically, I think “days until proposal passes” is a more intuitive chart axis to think about than “% of common pool,” and setting the funding request amount is more intuitive than an arbitrary time length.